
Spectral Drift and Cannabis Terpene Quality
Not only the THC percentage, but also aroma, flavor, and the "entourage effect" terpenes are critical in the market, which means the cultivation clients you serve, supply, or invest in are increasingly judged on terpene consistency, not just potency.
Whether the lighting actually delivers consistent spectrum and output over its working life becomes important for terpene quality.
Some commercial LED grow lights drift. Sometimes fixture to fixture, sometimes over a single photoperiod, sometimes over months of use.
We manufacture LED fixtures for horticulture, so we spend a lot of time on exactly this problem. Diode binning tolerance, thermal performance, and spectral uniformity are three main factors for spectral drift. In turn, the spectral drift affects the terpene quality.
What the Research Actually Says About Light and Terpenes
Light spectrum absolutely influences terpene and cannabinoid production in cannabis. That part is well established. UV-A exposure, blue light, and the red-to-far-red ratio all interact with plant photoreceptors and stress responses that drive secondary metabolite production, including terpenes.
But if you've read enough grow-light marketing copy, you've probably seen "UV-A boosts terpenes" presented as a settled fact. It isn't, and it's worth knowing that before you repeat it to a client or bake it into a spec.
A 2025 controlled study testing three UV spectra at five intensity levels found that one specific UV-A: UV-B ratio and intensity increased linalool, limonene, and myrcene concentrations by 22–29% over a no-UV control, but only one of the tested combinations actually worked without hurting yield or cannabinoid content. [1]
Other peer-reviewed research has found the opposite: one study concluded that UV exposure produced no commercially relevant improvement in terpene or cannabinoid content, and that terpene concentration actually decreased as UV exposure increased in the cultivars tested. [2]
A separate trial found supplemental UV-A increased THC in some genotypes while simultaneously decreasing terpene concentration across every variety tested. [3]
A broader review of the field sums it up plainly: how wavelength, bandwidth, and intensity affect cannabis secondary metabolite production "remains unclear," and results depend heavily on cultivar, exposure duration, and intensity. [4]
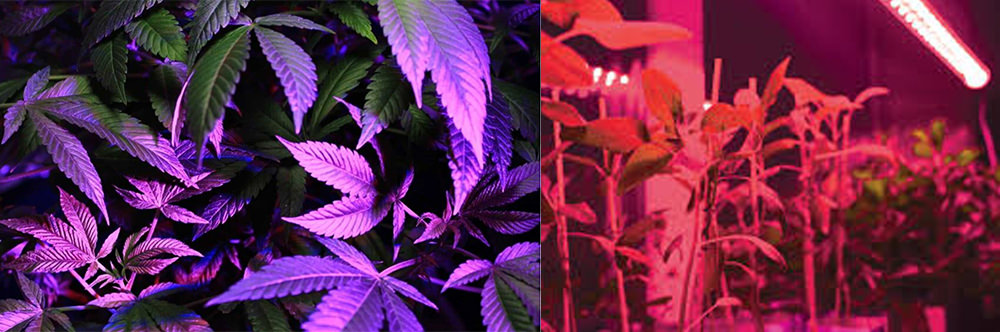
This matters for anyone sourcing or specifying lighting, not just growers. If a fixed, one-size-fits-all UV recipe worked reliably across cultivars and growth stages, there'd be no reason to pay for adjustable, precision-tuned fixtures. A cheap, static spectrum would do the job. The fact that outcomes vary this much by intensity, ratio, and cultivar is the actual argument for building your product line, or your facility, around lighting that can be dialed in and verified, not around a manufacturer's one-size-fits-all claim.
That is why we have a dedicated optical team of 10 people. We design custom lenses, provide lighting simulations, and support spectrum simulations for various crops and environments.

Why Spectral Recipes Drift in LED Grow Lights
Any manufacturer can put an impressive-looking spectral chart on a datasheet. Whether the fixture actually holds that spectrum, fixture to fixture and month to month, comes down to three engineering decisions most spec sheets don't mention at all.
Diode Binning Tolerance
Most LED manufacturers sort diodes within a binning tolerance of up to ±10 nm at peak wavelength. In practice, this means two LEDs labeled as the same wavelength can still output slightly different spectral peaks and intensity.
In controlled research environments, that variation is manageable. In commercial cannabis production, especially where UV-A and blue light are being used to influence secondary metabolites, a 10 nm shift can change how the plant perceives the light signal. That leads to variability in photomorphogenic response and, ultimately, chemical expression.
Thermal Spectral Shift
LEDs don't hold a fixed peak wavelength once they're running. As the diode's junction temperature climbs, the emission peak shifts toward longer wavelengths, a well-documented effect of band-gap narrowing under heat. The commonly cited rule of thumb is roughly 0.2–0.3nm of peak-wavelength shift for every 1°C rise in junction temperature.
A fixture with weak thermal design that lets junction temperature climb 20°C over a photoperiod could drift several nanometers by lights-off, meaning the spectrum at hour 11 isn't what it was at hour 1, even if the datasheet only lists one number.
In production terms, the plant is not receiving a stable spectral recipe across the full cycle, thus, inconsistent terpene quality. At Atop lighting, we not only focus on the thermal design but also on strict thermal tests to ensure long-term stable lighting performance.
Spectral Uniformity Across the Canopy
Even with tightly binned, thermally stable diodes, fixture-level design can still create a third problem: the spectrum delivered can change depending on where a plant sits under the fixture.
Poor optical design, reflector geometry, or uneven diode placement can shift the ratio of far-red to blue light from the center of the canopy to the edges. The result isn't just dimmer light at the edges. It's a genuinely different spectral recipe reaching those plants, which undermines exactly the consistency your customers are paying for.
How We Verify Spectral Output
Anyone can publish a target spectrum on a spec sheet. The harder, more useful question is whether a fixture actually delivers that spectrum, consistently, over its working life.
As your trusted OEM/ODM partner, we don't just supply products; we provide a complete engineering ecosystem designed to accelerate your product development lifecycle while ensuring reliability.
- Every fixture's actual output is measured: We use a 2-meter integrating sphere to capture spectral power distribution across 200–800nm, covering UV and IR along with the visible range, following IES LM-79 photometric testing standards.
- Long-term degradation is tracked: LED lumen depreciation is measured through LM-80 testing (6,000–10,000 hours of real operating data) and projected forward using TM-21 methodology, which lets us tell a customer when a fixture will realistically fall to 90% (L90) or 70% (L70) of its initial output.
- Testing happens in-house, under third-party-qualified conditions: Our lab is SGS- and TÜV-qualified and runs 66 distinct test types, so verification isn't outsourced or occasional. It's built into every production run.
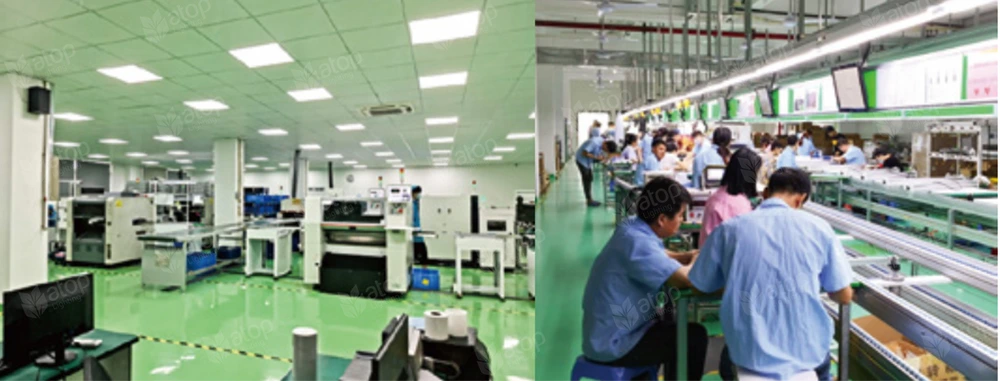
- We can prototype and iterate fast: In-house SMT capability means we can turn a new UV-A integration or a revised far-red-to-blue ratio into a validated physical prototype in a fraction of the time a typical multi-vendor supply chain takes.
- We can hold that consistency at real production volume: Fourteen dedicated production lines across facilities in China and Vietnam give us capacity of up to 1,500 fixtures per day, so a custom spectral build doesn't mean boutique lead times or minimum-order penalties.
Every Project Has Different Numbers Worth Comparing
What about our solutions for medical cannabis cultivation?
We've built adjustable, multi-channel fixtures, independently controllable across white, deep red, far-red, and UV-A bands, for customers who needed a spectral recipe that could shift stage by stage from seedling through harvest rather than run one fixed spectrum for the whole cycle.
The right setup, target metrics, and expected numbers depend on your region, your genetics, your growth stage requirements, and your production scale, so rather than generalize, we'd rather walk through your specific project.
Contact our engineering team, and we can share relevant test data and project specifics directly.
Source:
[1] UV Light Intensity and Spectrum Influence Cannabis Growth and Terpene Profiles, 2025.
[2] Cannabis Inflorescence Yield and Cannabinoid Concentration Are Not Increased With Exposure to Short-Wavelength Ultraviolet-B Radiation, Frontiers in Plant Science, 2021.
[3] Combination of red and UV-A light enhances hemp (Cannabis sativa L.) inflorescence yield and cannabinoid content, Scientific Reports, 2025 (citing Jenkins & Livesay).
[4] Cannabinoids and Terpenes: How Production of Photo-Protectants Can Be Manipulated to Enhance Cannabis sativa L. Phytochemistry, PMC, 2021.
Disclaimer: This Content Is Intended For Educational Purposes Only. We Do Not Endorse Or Promote Illegal Activities Related To Cannabis.